(Menu details)
APPLICATION SOFTWARE FOR DAYBREAK TL/OSL SYSTEMS
FirstLight 2.0
We have put a great deal of effort during the past three years into improving the ease of use of TLAPPLIC, our original software package first released in 1980 for the Apple II (if you can remember that far back), now in its final DOS version, 4.30. We have added in that time new features, new methods, and an entirely new and comprehensive fitting suite. This all has been in preparation for FirstLight 2.0 for Windows 95/98, scheduled for release in January 2001. A great concern in the development of this new software has been to make the software intuitive, easy to use, and a easy transition for TLAPPLIC users. FirstLight conforms to Windows user interface standards, so there should be no surprises. As the project moved ahead, we saw some opportunities to improve on the original specification, and have implemented some very nice features that add to the user friendliness, power, and ease of use. This did cause the initial release target date to be pushed back a bit, but we believe the improvements are more than worthwhile. The data taking portion will remain a DOS program for a while (but enhanced with a script interpreter for very powerful and easy system control). We have been working on data communications in Windows and have a very robust version of TLCONSOLE, the system status display and control window, running now for a year in Windows 95/98. Writing an entirely new version with all the improvements we plan will take a while, and we decided to make the first release of FirstLight without a fully integrated TAKEDATA in order to get it to you as quickly as possible. The new software is best run with a video resolution of 1024 x 768 or higher, to accommodate display of the file database and multiple windows. The initial release will be a collection of programs running under Windows 95/98, all of which may be run simultaneously--FirstLight, FirstLight Script Editor, and FirstLight Console. Data taking, as mentioned, will still be done under DOS. While it is possible to run this in a DOS window under Win95/98, we do not recommend it because some other program running at the same time could crash the system and compromise data security. There is a description of FirstLights windows and inter-window messaging at the end of this section.
Our emphasis from now on is going to be on flexibility. The use of scripts for data taking is one important part, but we are as well approaching a universality of data format, also defined by a type of script file definition, and covering both binary and ASCII formats. We are switching soon to an ASCII format as the preferred data storage mode (for ease of transfer and archiving, as well as making ready for XML). We will have scripts for defining this output format, which will also be used for the input filter to the computation part of the application. We are exploring possible scripting for computations as well, and are working toward an XML-ready data environment so that all measurements, computations, and data organization will eventually be done in the context of an XML browser, and the powerful database tools it will have available. We have plans to implement a complete hierarchical XML database allowing storage of information, whether it be curve data files, results, images, papers, or bibliographies, or anything else in a multi-level scheme defined by the user. This could have laboratory-general information such as irradiator calibrations, common protocol scripts, and data structures (XML tag definitions), then a project level with its specific information, and then a sample level with all data specific to that sample.
Since the status display of the 1000-series itself provides only rather basic information about what is happening inside, a good virtual display on the computer screen is a necessity. We have used a two- tier status display, so that mostly you will have only the information necessary for the job at hand, with anything resulting in an abnormal condition shown as an error flag. Commands here are implemented as buttons. If more detailed information is needed, or you need to command the system for alignment or trouble- shooting, the TLCONSOLE screen may be accessed at any time (except during a glow curve or shinedown), simply by pressing the right hand mouse button. In TLCONSOLE, all the commands, sent as text strings, are possible, including dumps of internal variables and data, and primitive mechanical motions, for isolating what problems might arise. The newest version of TLCONSOLE has a comprehensive online help displayed at all times. When the first character of a command is entered, a complete description of its parameters is shown.
The key to a successful automated system is a quick and easy means of entering a control program, that informs the system what to do with each sample disk, and informs the software what to enter into the record that describes the glow curve. We have two methods of program entry that endeavor to minimize the work involved in accomplishing this: batch record programs and scripts. The first has been a feature of TLAPPLIC for a decade; the second, much more convenient and powerful, is new in 2000.
CLASSIC BATCH PROGRAM: With lists of frequently used alpha, beta, and gamma exposures and doserates entered in updatable system information files, and a data entry scheme optimized for a mouse, the keyboard is seldom required, except to enter new file names, and remarks. If you wish a background curve for each sample disk, it can be entered automatically. You may put data from a load of sample disks into multiple files. Editing is simple, and you may save batch program files for later modification and re-use. Such parameters as OSL excitation and timebase, or ramp rate, endpoint temperature, and preheat time and temperature, may be altered from disk to disk, if desired, for special purposes, and sample positions need not be sequential. Mixed TL and OSL measurements are supported. In short, almost anything can be done. For normalization, the batch program can be automatically generated according to a set of parameters you set up. While we do not at this time do any kinetics analysis, the batch program can be set up for making all the measurements, and data then may be transferred to a spreadsheet program for any special computations. We have tried to anticipate your needs and think that we have succeeded in devising a powerful tool for setting up an automated sequence of runs which is, at the same time, quick and easy to use. In the DOS version, up to 401 curves in a file are supported. In FirstLight there is no limit, and the datataking portion of the software will soon conform.
SCRIPT EDITOR: In the past year, we changed our approach to system control. Originally we had thought to have a number of set methods, then a number of parameters that would be entered; when processed, this would result in a batch program file. During the meeting in Rome last September, we realized that methods have fragmented to the extent that hardly any two people are using the same measurement protocols. Because of this, we have completely generalized the measurement scripts, so that virtually anything you can imagine can be accomplished. A script is an ASCII text file, editable however you please, in a simple procedural programming language, with variables, list arrays, procedure definitions, and loops. It may have as its final output form a batch program file to be used by TLAPPLIC, or now may be executed directly by the TakeData portion of the software. We are providing a complete suite of scripts for all currently accepted measurement protocols, and a detailed manual to allow the user to devise his or her own scripts. Two sample scripts are presented at the end of this document to give a taste of the approach.
There is also a first version of a generator of worksheets with check-off boxes, derived from the script, that may be printed for use in shepherding a sample through external irradiation, bleaching and measurements. This should be very helpful in organizing the measurement process, and reducing operator errors in complex measurement protocols. At each step of a process where disks are moved between reader and irradiator or other equipment, there is a check box with its position in each instrument together with the radiation dose, bleach time and band, etc., as appropriate. We realize that everybody works differently, but expect that a limited number of variations should satisfy almost every user.
Later, we plan to implement some simple conditionals for control. For example, if an IR measurement on a quartz sample shows the presence of feldspar, that disk could be discarded from the measurement sequence. In SAR, the regen doses could end when the signal exceeded the natural signal. And so on. We would appreciate suggestions. We are also planning to incorporate access to external procedures, so that control of other equipment and processes may be possible during data taking. We have not begun to explore the possibilities here, beyond turning on the coffee maker at a certain point in the run, or chanting incantations at the appropriate times to assure good data.
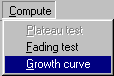
Now, once the batch program sequence is entered or a script is loaded, the system is set up for automatic operation. Load the samples, pull a vacuum, purge, turn on the HV, and hit the GO button! Now you can go home for the night or weekend; everything is automatic from now on. Background is automatically subtracted and written into a separate file (the raw data is never lost or replaced; all operations on the data are held in the separate .SUB file). When a file is opened for recording data, dummy records are written to reserve space on the disk and overwritten later with real data; this way no data can be lost due to an abnormal program termination. The system will shut itself down on completion of the batch program: gas flow and HV off, sample position back to zero, and ready for more work. Of course, the data is displayed as it is received, with a realtime graphics display modeled on an XY recorder. You may pause after a glow curve to make system adjustments, go to COMPUTE (the data reduction portion of TLAPPLIC) to look at recorded data (or see the plateau or growth curve), or edit the batch program, and then resume. You have complete control when you want it. There is a panic button, too, just in case. The only time operator intervention is required is when you choose the batch irradiation mode where all irradiations done on the system (rather than externally) are performed at one time. Here the irradiator is placed onto the system, and removed when irradiations are complete, before continuing on to collect data. If the 770 beta irradiator is present, everything is automatic.
The data reduction has been made simple, but full of useful features for background subtraction, temperature shifting, numerical filtering, normalization, and display. Growthcurve analysis in particular has been made very easy to use. We have incorporated enough intelligence so that glow curves appropriate for each method of analysis (we have included all the major ones for standard TL and optically bleached methods in archaeology and geology) are selected automatically, saving a great deal of time. Bad glow curve data may be flagged and disregarded. We have very fast fitting routines with a variety of weighting and error models for computing uncertainties.
The FirstLight package has an internal database as its foundation. There is a specification file that contains the file format (presently only binary file structures are supported, but ASCII formats are in the works for later release). This means that in the future, any file format whose specification is known may be read in. It may be necessary to add certain information for some formats to be entered properly for computations in FirstLight. We have developed a very powerful general technique for reading files of records, and plan to make a file transfer and edit utility available to all, free of charge. This will make it possible for files to be translated into a form suitable for the various software packages others have written. We hope that this will be of benefit to the entire community, and give others incentive to make their own calculation programs useful to all. As a result of this we will have to institute software security measures in order to prevent unauthorized copying of the Daybreak programs. We are evaluating several methods at this time, and promise to keep it from being an annoyance to the licensee. This winter or early spring, together with some of the people cooperating with us in this freeware project, we will be issuing a call for file formats. If you know of any groups with their own formats or calculation software, please let us know so we can contact them.
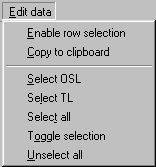
Once the file is read into FirstLight's database, it is possible to view and edit all fields, either one record individually or as groups. There is no practical limit to the number of data records in this implementation. Curves may be deglitched if necessary both automatically and manually. The curve display window includes the curve portion of the selected records and selection of a point on the graphics display puts the focus of the database at the chosen point for ease of modification. Curves for display may be selected manually from the database, or by class (same type of irradiation, bleach treatment, or other criteria set by the user). The graphics display has controls for scaling and panning that are very flexible but simple to use, and there is high resolution printing with a memo edit box available for optional user comments. There are two forms of window for the editor, one specifically for Daybreak files with explicit interpretation.
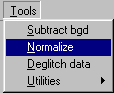
From the edit window one may proceed to data manipulation and computations. Basic data processing includes background subtraction (with several modes available for OSL), temperature shifting for TL (display a class of curves, grab the curve to shift, and drop it where you want, or select it and enter a shift manually; there is a ledger line available to aid in lining up curves), automated or manual normalization, and simple fading and plateau studies. Additional functions include posting data base information selected by the user to a spreadsheet, the Windows clipboard, or to a text file; ROI integrals, and the other utilities available in TLAPPLIC are also implemented. Computations are performed as in TLAPPLIC, with the same methods available. The selection of curves to enter the computations is expanded, as there may be many different 'devices' present in the file. Each OSL excitation and separate system setting (timebase, sample temperature, etc.) is a different device, as is TL. Multiple detectors such as the IRIS4 are supported. A tabbed display (a tab for each device) shows the methods that may be used for computation with the data available for the device. Curves may be marked for non-use from any of the windows displaying data in any form (record list or graphics window--either curve display or growth point display). The fit function, error model, and range of temperature or channel are selected, and the computation is then done. You may select a point on a plot of ED vs T or channel and display the growth curve for that point in another window. All windows communicate with the others, so a change in one is reflected in the rest. For example, a point in the growth curve display might be selected with the mouse, and all curves having the same dose will be highlighted in the curve preview window, and the records in the record list will be highlighted. We believe that you will not find it difficult to move from TLAPPLIC to FirstLight, and will find the increase in function worth the wait.
The calculation methods available in FirstLight include all those in
current use: standard unbleached, regeneration, r-dose, residual, second
glow intercept, additive/regeneration (slide method), first/second glows
('slide' for ceramics), alpha efficiency, alpha growth, and single aliquot
additive and regenerative OSL. Functional fits include linear and
polynomial through degree=9, saturating exponential and saturating exponential
plus linear. These last use an iterative method with automatic parameter
starting point determination for fast convergence. The method is
applicable to any nonlinear function, so that new functions may quickly
be added as they become useful. Weighting is done based on one of
four models: equal errors, errors calculated from data scatter, constant
relative error and constant relative variance. Chi-square and R-square
values are returned for evaluation of goodness of fit. Solutions
may be written to a special log file in ASCII format for later inclusion
in documents, or written to the printer. A directly compatible spreadsheet
format is available for use as input to plotting programs.
The software also includes a very flexible age computation program
with full error analysis. It is a 'fill in the blanks' procedure where
the form on the left half of the screen adapts to the type of doserate
information available. The form reconfigures itself, retaining current
data and putting up blanks for any additional data required, if the computation
parameters change (e.g., between environmental doserate measured by TL
or gamma counter and doserate to be computed by alpha counting and so on).
When the data set is complete, the partial doserates, age, and errors are
displayed on the right of the screen. It then is possible to change
any value of a data parameter, and instantly see a new solution.
Once the doserate information is available, it may be used together with
the ED and alpha efficiency to obtain an age plateau.
We include a large number of utilities for curve plotting and listing,
integration over multiple regions of interest, and writing to several useful
formats compatible with spreadsheet programs for any special operations
or plots you may desire
.
One software license covers all our systems, and your license permits
use of up to three Daybreak systems in your department. We do not
use any form of hardware protection, or "dongle", to discourage unauthorized
use, but trust to your honesty and goodwill. We do make you sign
a commonsense licensing agreement. Software updates are free of charge
for two years, and very reasonable (often free) thereafter.
AN OVERVIEW OF FIRSTLIGHT 2.0
The main portion of FirstLight comprises two types of windows interacting
with a user and with one another. The first is presented below. It
consists of a specialized database editor for editing the contents of Daybreak
data files (i.e., files with suffixes: DAT, SUB, SAD and SAB). It is also
used as an interface to access other program tools necessary for data manipulation,
reduction and analysis. The configuration can be changed to a general
user-configurable editor for any file for which we have a file format.
This latter form will be distributed as freeware.
(Menu details)
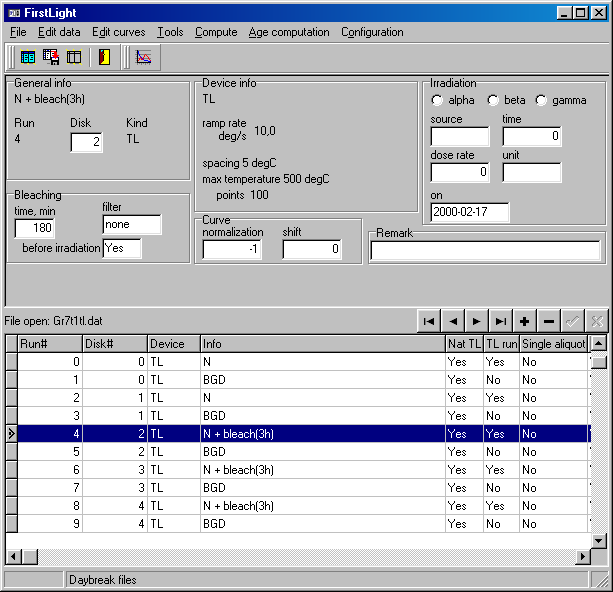
The top portion of the window displays the data from the selected curve
in a readily intelligible form with fields derived from the data base.
We store a very complete set of data as measurements are made, all defined
by the script or batch program as it is executed. No post-processing
is necessary as with other software.
Not shown in this view is the online help availability, or the hints that label each icon as the mouse cursor passes over them. We have a useful help system that will get more complete in the next release later in the year. It may be printed out and serve as a helpful aide de memoire, supplemental to the manual.
A smart selection window, based on curve attribute checkboxes will shortly augment the Edit data window above. The system data, containing information about system configuration, preferences, and radioactive sources, uses the present TLINFO file, containing up to eight system profiles, for the sake of compatibility with the DOS TakeData. It will become a database in its own right when we switch to the Windows TakeData later in 2001.
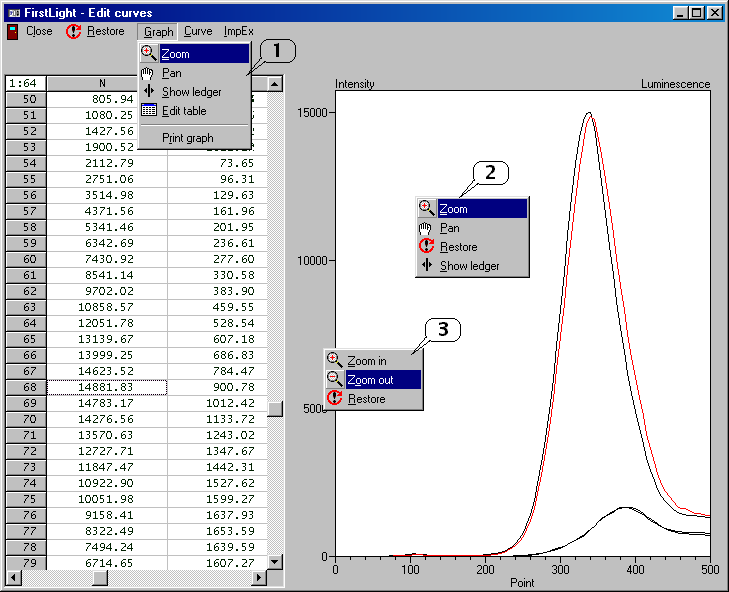
The other type of window, shown next, is used for graphical and numerical
presentation and the editing of TL/OSL curves, and for visualization of
computed results.

A point or curve selected on the graphical side results in a change of focus in the data table to that point or curve. This makes any necessary deglitching, not conveniently done automatically, a very simple task.
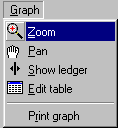
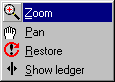
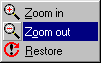
The picture below shows the curve data editor with several examples of pull-down and pop-up menus available to the user. In particular, the user may edit numerical results of measurements, shift and normalize whole curves, etc.
 1
1
 1
1
 2
2
 3
3
(menu details)
Below we see an example of a complex system of interacting windows, presenting measurement data and analysis results, during the growth curve fitting and computations of the paleodose. An action taken by the user in any of these windows is reflected in all the others. This is achieved by applying the messaging system windows send and receive messages to and from each other to notify about changes in data made by the user or changes in results generated by the program.
Results of computations are presented in several forms simultaneously.
The Solution sub-window in the main window (upper right part above)
contains numerical results of computations that may be easily transferred
to an external file or directly to (through a Windows clipboard) any other
spreadsheet or text editing program.
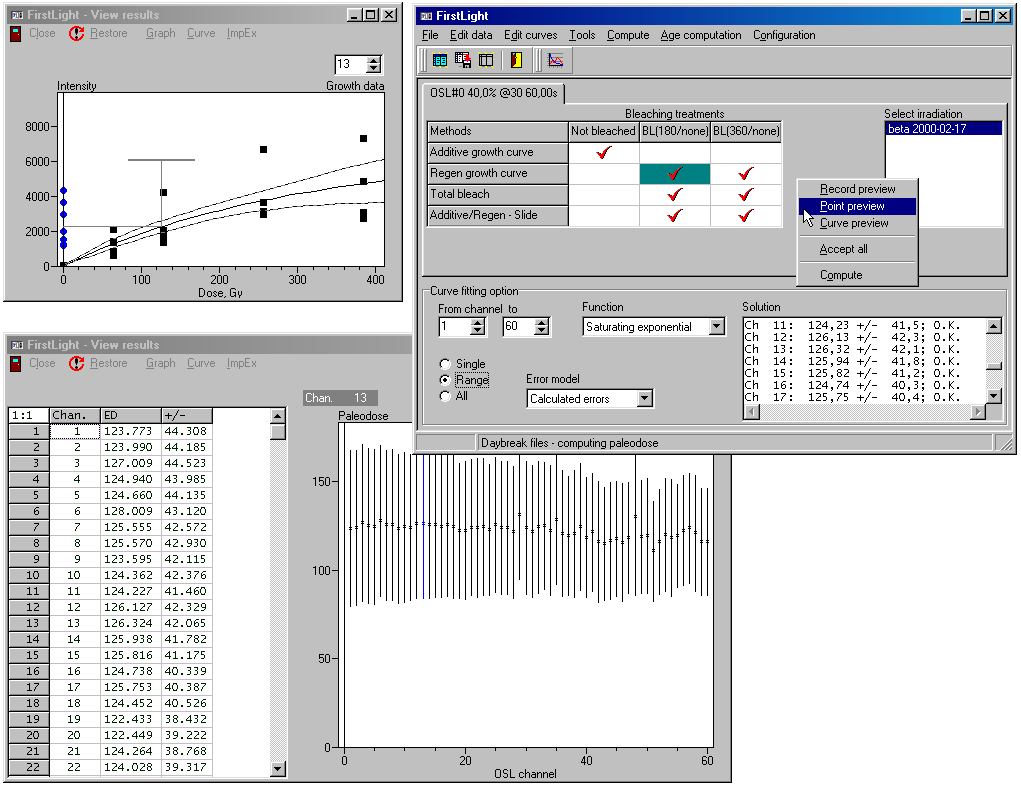
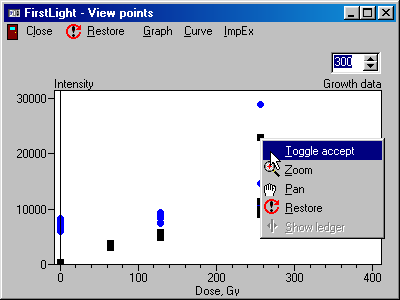
Measurement results may be viewed prior to computations. The user may
also select or deselect individual points before or during computations
immediately seeing changes in the final result.
EXAMPLES OF SCRIPTS
A simple script is shown below. To prepare it for execution by TakeData, the fields represented by ? are filled in in the script editor and posted to TakeData. The LIST of disk numbers can be filled automatically in a number of different ways, as can the list of doses. We have utilities to view all the operations done on a particular disk, and to view all the variables and lists. One very useful feature is the generation of worksheets which detail all the operations in which sample disks are moved to and from irradiators, bleaching lamps, etc. They are in essence 'checklists' that should ease the inevitable communications gap between you and your students or technicians (or, for that matter, between your own self from one day to the next!). You can see that a number of sequences are first defined, and then executed in a loop on the list of sample numbers and doses. Such things as filenames can be defined here, making the taking of data completely automated. The script, instantiated for a particular sample, can be stored together with the data (and should be in an XML environment!), at the sample level
METHOD DEFINITION "Single aliquot regenerative dose method"
GLOBAL
OSLDev = ?
OSLPow = ?
RampRate =
?
CoolTemp =
?
SampleTemp
= ?
IrradSource
= ?
TestISource
= ?
IrradTemp =
?
TestITemp =
?
IrradPos =
?
TestIPos =
?
PreTemp = ?
PreTime = ?
TPreTemp =
?
TPreTime =
?
TestDose =
?
OSLTime = ?
BlchTime =
?
BgdTime = ?
LIST Doses
= (?)
END GLOBAL
SEQUENCE
Sequence0 = ( OSL(OSLDev, OSLPow, SampleTemp, OSLTime, BlchTime, BgdTime) )
Sequence1 =
( Sequence0,
IRRAD(TestISource, TestIPos, TestITemp, TestDose),
PREHEAT(RampRate, TPreTemp, TPreTime, CoolTemp),
NORM Sequence0 )
Sequence2 =
( IRRAD(IrradSource, IrradPos, IrradTemp, &Doses),
PREHEAT(RampRate, PreTemp, PreTime, CoolTemp),
Sequence1 )
END SEQUENCE
METHOD SINGLE_ALIQUOT
LOOP DISKS
PREHEAT(RampRate, PreTemp, PreTime, CoolTemp)
Sequence1
LOOP Doses
Sequence2
END LOOP
END LOOP
.
The next script is more complex, but you can see the form of the logic and how a complicated protocol can be described. Imagine having to enter all the curve data manually! The disk numbers still are to be assigned by the script editor
METHOD TEMPLATE "TL slide"
GLOBAL
RampRate =
10
EndTemp = 500
CoolTemp =
60
HoldTime =
0
PreTemp = 200
PreTime = 20
IrradSource
= 3
IrradTemp =
30
IrradPos =
1
NIrrSource
= 3
NIrrTemp =
30
NIrrPos = 1
NIrrTime =
1
NPreTemp =
200
NPreTime =
20
BlchDev = 1
BlchInt = 1
BlchTemp =
30
ED = 150
LIST Add =
(0#8, 0.33*ED#5, 0.67*ED#5, ED#4, 1.33*ED#4)
LIST Reg =
(0#3, 0.33*ED#5, 0.67*ED#5, 1.33*ED#5, 2.0*ED#4, 2.67*ED#4)
LIST BlchTime
= (180, 360)
END GLOBAL
SEQUENCE
Sequence0 =
( PREHEAT(RampRate, PreTemp, PreTime, CoolTemp),
TL(RampRate, 0, 0, EndTemp, HoldTime, CoolTemp),
TLBGD(RampRate, EndTemp, CoolTemp),
IRRAD(NIrrSource, NIrrPos, NIrrTemp, NIrrTime),
PREHEAT(RampRate, PreTemp, PreTime, CoolTemp),
NORM TL(RampRate, 0, 0, EndTemp, HoldTime, CoolTemp),
NORM TLBGD(RampRate, EndTemp, CoolTemp) )
Sequence1 =
( IRRAD(IrradSource, IrradPos, IrradTemp, &Add),
Sequence0 )
Sequence2 =
( BLEACH(BlchDev, BlchInt, BlchTemp, &BlchTime),
IRRAD(IrradSource, IrradPos, IrradTemp, &Reg),
Sequence0 )
END SEQUENCE
METHOD MULTIPLE_ALIQUOT
OPEN "script04"
LOOP Add
LOOP DISKS
Sequence1
END LOOP
END LOOP
LOOP BlchTime
LOOP Reg
LOOP DISKS
Sequence2
END LOOP
END LOOP
END LOOP
END METHOD